Debugging Android Apps Like a Pro: Essential Tools in Android Studio
Fix Your Android App Without Throwing Your Computer Out the Window

So what will you learn from this blog 🤔
Debugging is an essential skill for every Android developer. Whether you're a professional or just starting, you will encounter bugs that can make your app crash, slow down, or behave unpredictably. In this blog post, we will explore the art of debugging in Android, including common tools and techniques that can help you identify and fix issues in your code. So grab your coffee, fire up Android Studio, and let's get started!"
About Me
Hi, I am Vaibhav. I am an Android Developer who has been developing android apps for the past 3 years. Currently, I am pursuing my bachelor's in Computer Science. I have been coding for around 6 years and in these many years, I have explored a lot of coding, from DSA to CP to Android, Backend and a little bit of Web Frontend. I have worked on multiple open source projects, freelancing work and interning as a Software Engineer - Android at Pratilipi. That's all about me, know let's dive into the blog and learn some cool stuff.
Structuring Of This Blog 🏛️
The content of this blog may be huge, but I'm keeping it structured so you all readers don't get tangled up, just like Spaghetti code 😝. So first we will get to know about the tools and techniques available to debug Android Apps. "What It is ?", "How it's used ?" and a few examples if any. I will also share some of my interesting adventures using it. We will go from down Debugging the Data layer to the Business logic, then to UI layout and finally up to the Performance.
The tools that we are going to learn in this blog are:
Database Inspector
Network Inspector
Logcat
Debugger
Layout Inspector
Layout Validator
Profiler
So without further adieu, let's start with our Debugging Tools and Techniques.
Database Inspector
What is it?
The Database Inspector is a tool in Android Studio that allows us to see and modify data saved in the app's database directly from the IDE. We can even run our SQL queries on the database in real-time. We get real-time updates on our database. This can be incredibly useful for debugging as well as for testing database-related features in our app.
How to use it?
Using Database inspector is quite simple, Firstly we need to run our app, of course. Then look for this App Inspection tab at the bottom, Press it and then select Database Inspector. Then this window will appear.
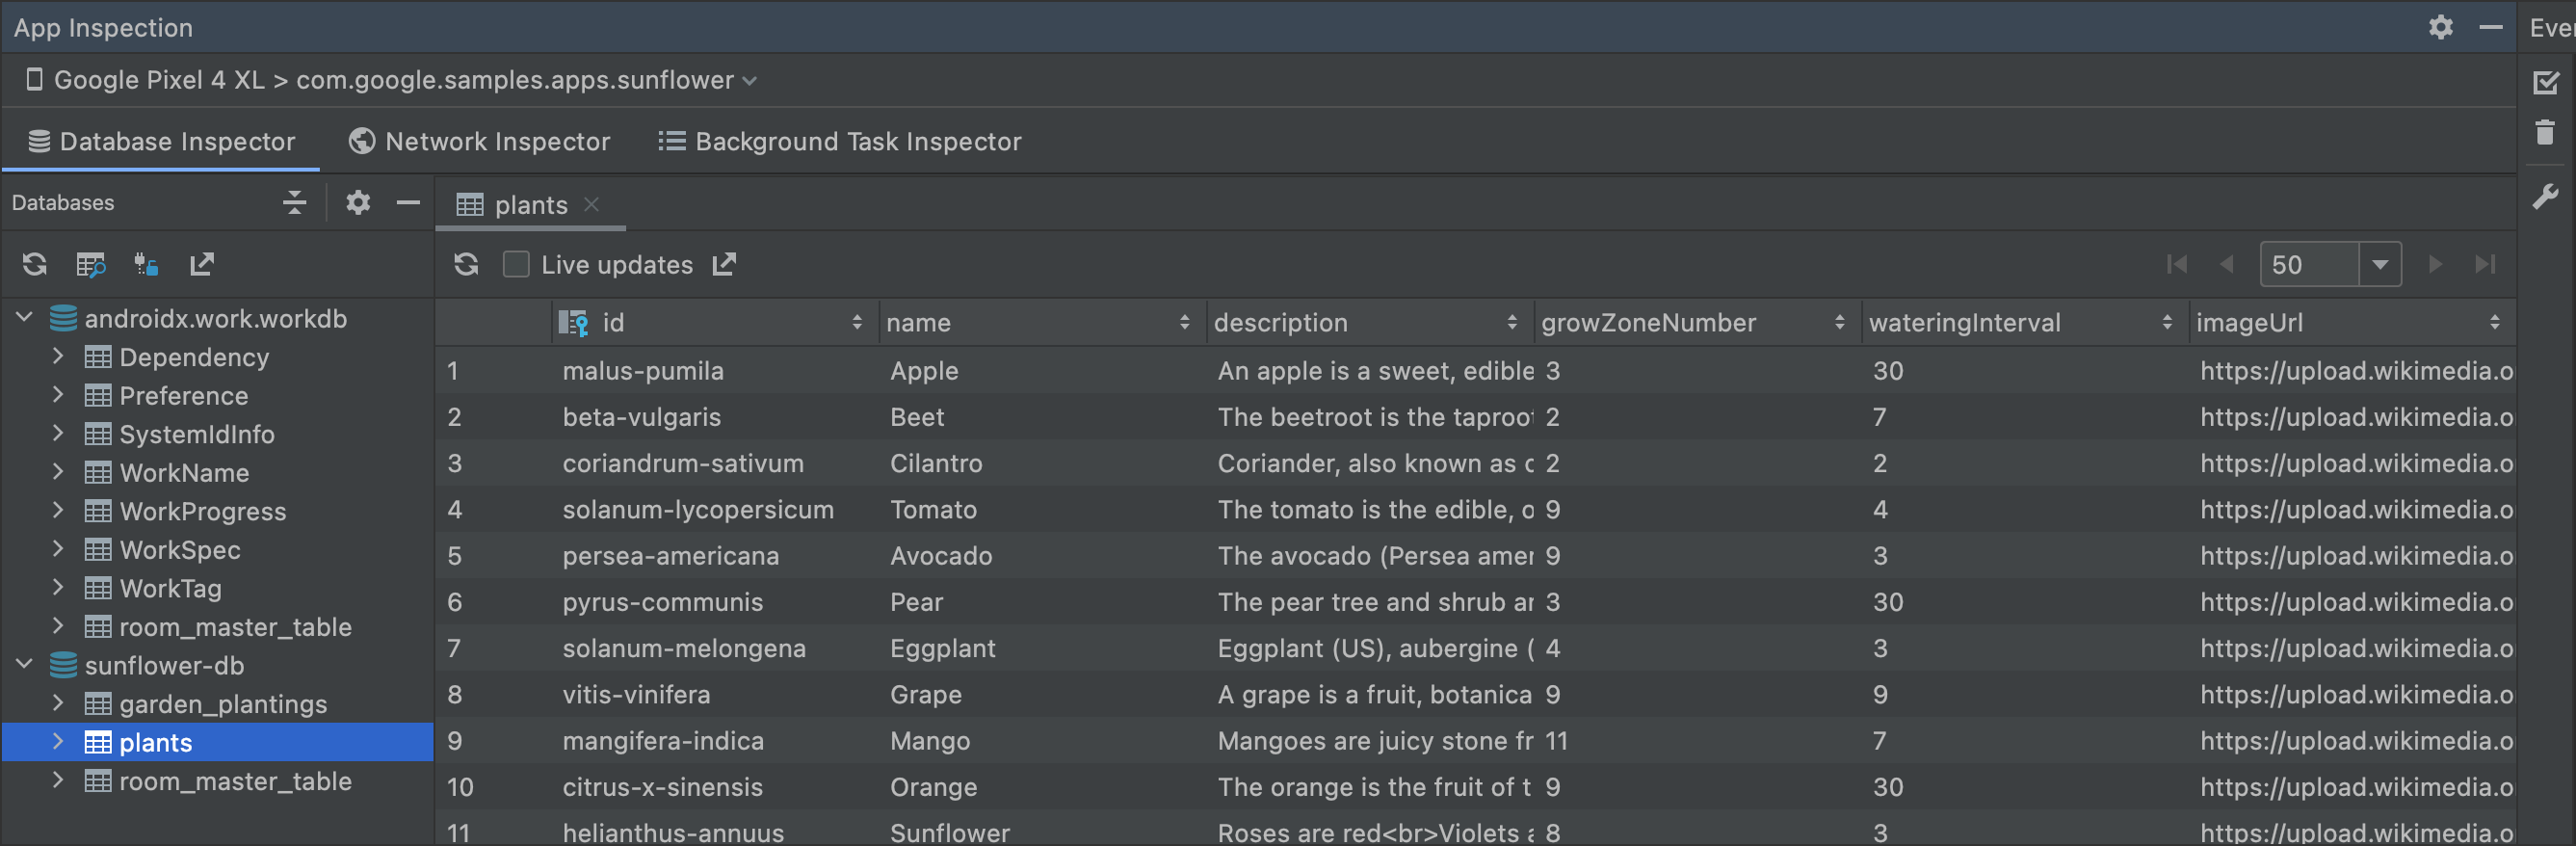
Here, you can see all your databases, and tables and after selecting any table, you can see the data saved in it. You can even write SQL commands to test them or run the queries you have written in your Room DAO to test if they return the result as desired.
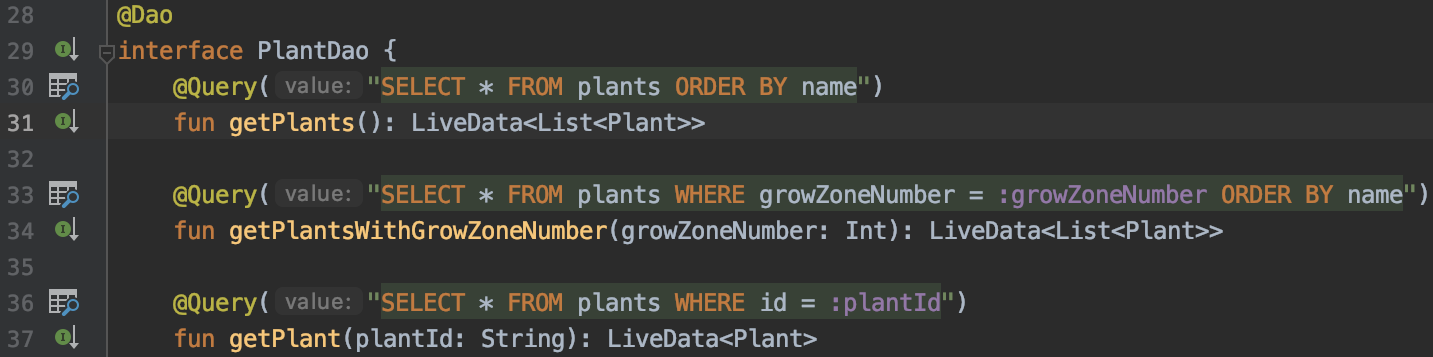
You can press the Search icon shown on the left of the query to run those in Database Inspector and test them.
This tool is very useful if your app has some database-related bugs that you can easily catch if you have made some mistake in writing some SQL query or the data is not being saved like you want it to be.
Network Inspector 🌐
What is it?
Network Inspector is the most helpful tool there in Android Studio. We often make API calls in-app and believe me or not, there are always issues happening with API calls, sometimes the response isn't correct or the request isn't being sent correctly,
getting some random HTTP codes and so many more. I am sure all Android Developers agree with me.
Here comes Network Inspector to the rescue, it shows us real-time activity on the device network, the API calls being made, the responses, images being fetched and many more. This helps us a lot in figuring out if the issue is while making API calls or in our business logic.
How to use it?
To use Network Inspector we need to first run our app, then press on the App Inspection tab at the bottom and select Network Inspector. Then a window like this will pop up in which you can see all Network calls being made.
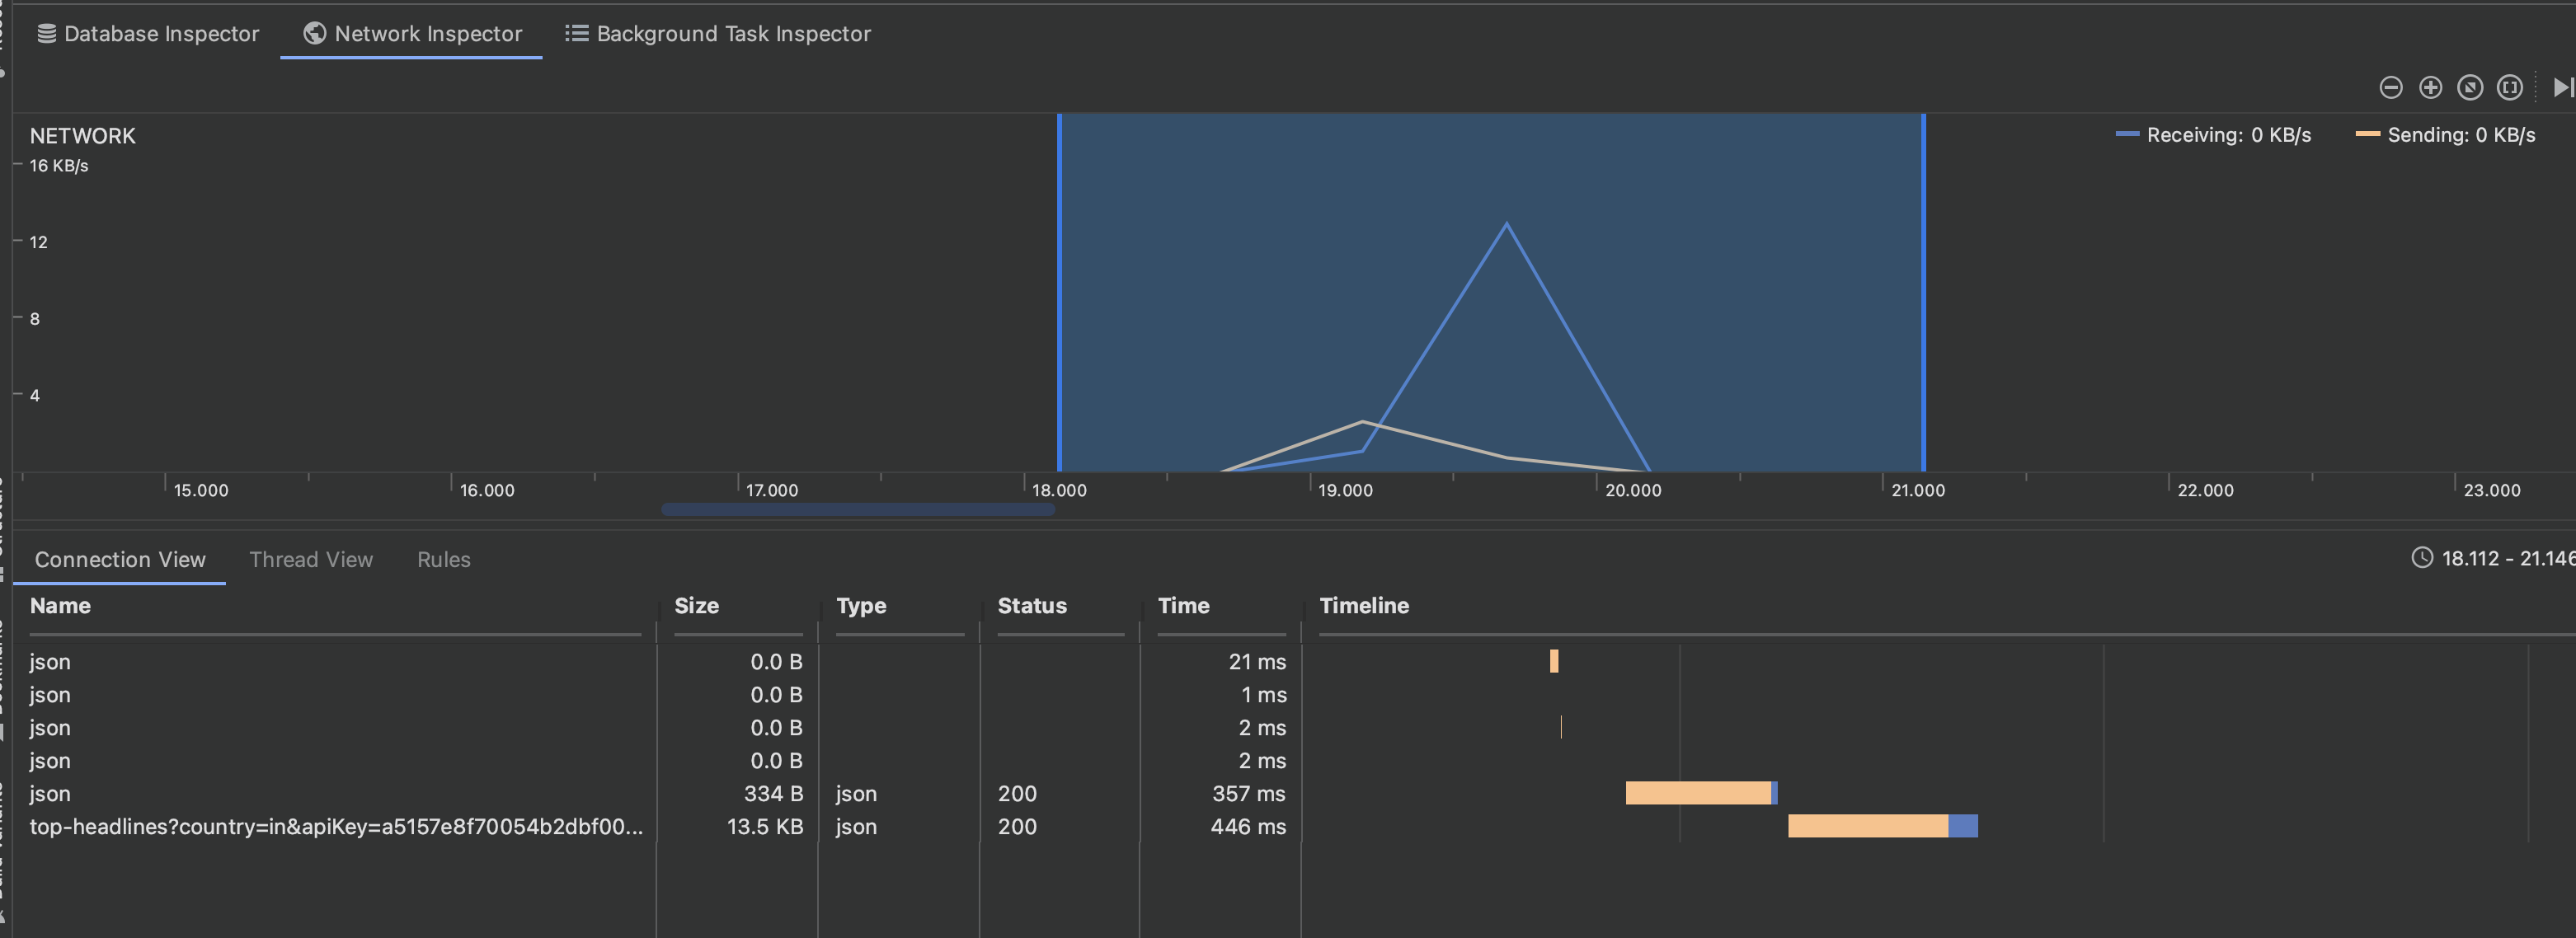
The bottom part shows all the Network calls being made and the time it takes. Pressing on any of the Network calls shows us the details of it. Pressing it will open a window on the right.
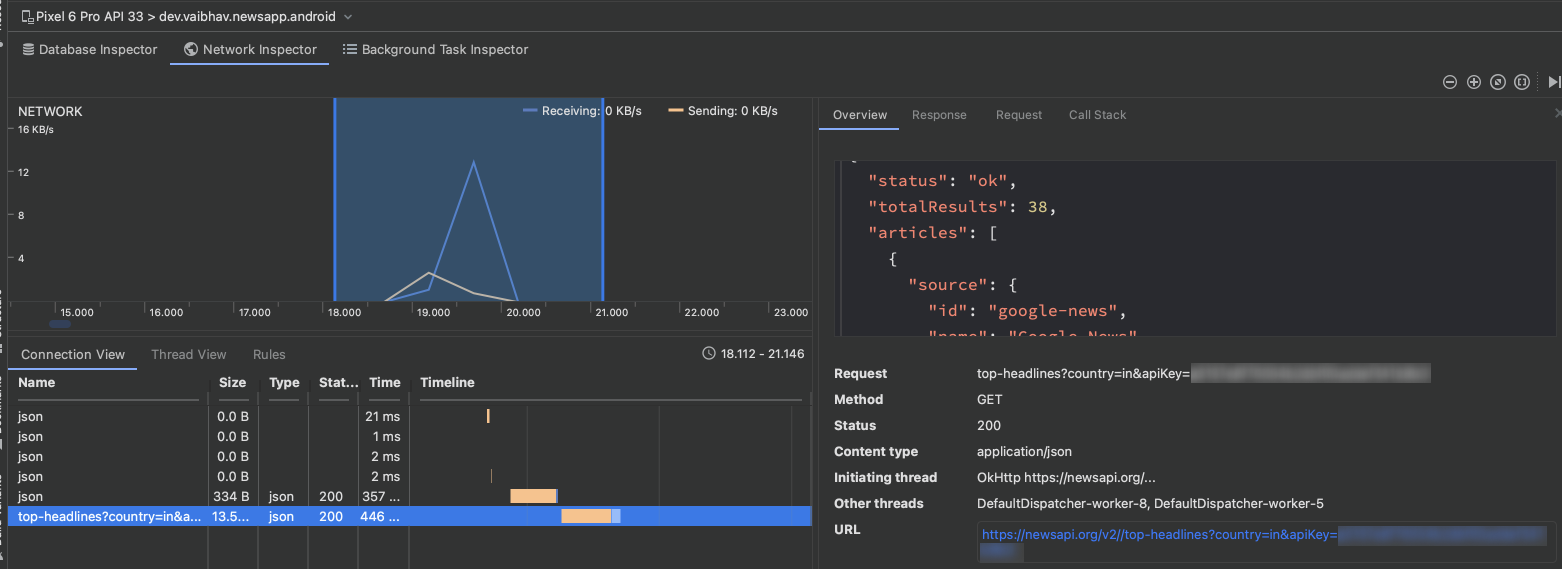
On the right, we can see the details of the API call made, the URL to which it's made, the headers, request, params, response and many other such details.
It is really helpful while you are pulling your hair thinking about why an API call isn't working and finding out you made a mistake.
How I found a silly typo in API Response using Network Inspector
While I was working on DocuBox, I faced an issue where my API call was just broken, the response was not of the correct type, Gson throwing exceptions with serializing and this made me frustrated. Then I used Network Inspector and compared the Response JSON and found a silly mistake done by my teammate, there was a typo that was messing up my API call 🤦🏻♂️.
Logcat 😺
What is it?
The all-time classic way of Debugging. Just keep typing print() statements back to back and find out where they went wrong. The classic "I am here" log still remains everyone's favourite. Jokes apart, logging is still quite powerful if used correctly. There are moments when adding breakpoints and using a debugger just does not seem to work, logging becomes really helpful in such cases.
How to use it?
Logging can be done using println() or using Android Log class to log using Log.d(tag, message). Using Android's Logger can sometimes be tiresome, mainly in creating those Tags. There's a very helpful library called Timber which automatically adds the Tag which is the name of the class in which the log is made.
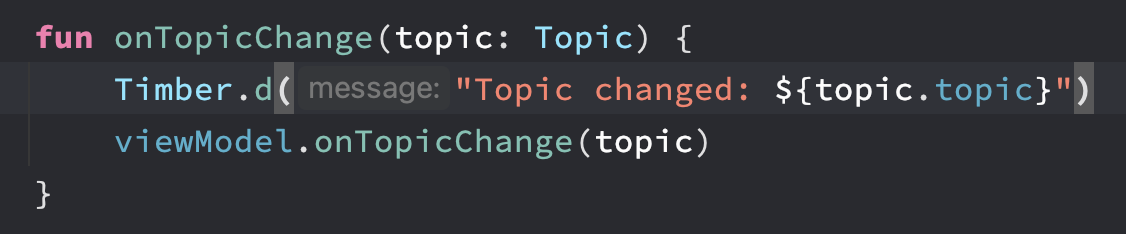
All the logs we write can be seen together in the Android Studio's Logcat.

Debugger 🪲
What is it?
Debugger in Android Studio is a powerful tool that allows us to identify and fix issues in our Android app. It enables us to step through our code, inspect variables, and set breakpoints to pause the execution of our code at specific points, helping us to understand the flow of our code and find bugs. With the help of the debugger, we can debug our code and see how it executes in real-time, making it an essential tool for anyone developing Android apps.
How to use it?
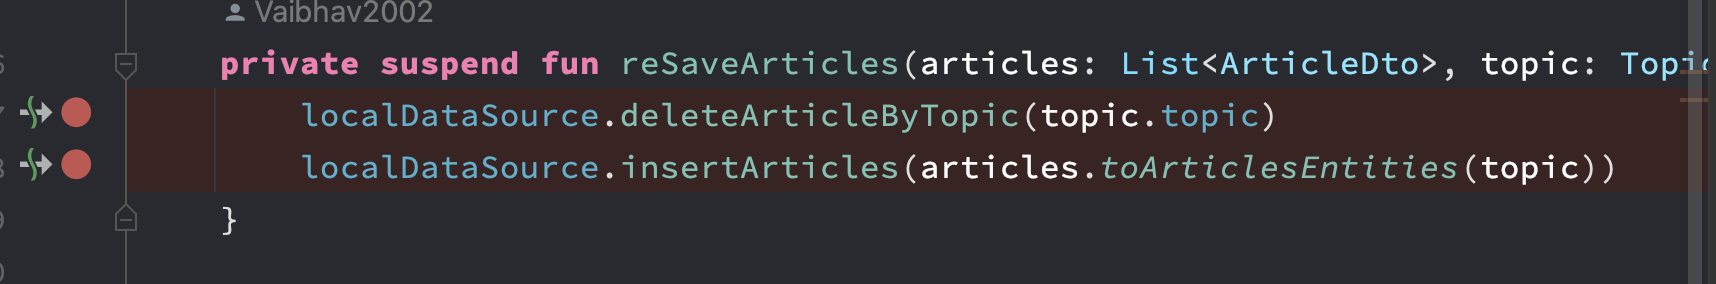
Using Debugger is quite simple, all we need to do is select the line number of the line at which we want our code execution to pause and a red highlight will appear on that line.
Then when we run code, its execution will stop at that line and this window will show up, displaying all the fields, and values at that time. We can even evaluate some expressions and find out their value.
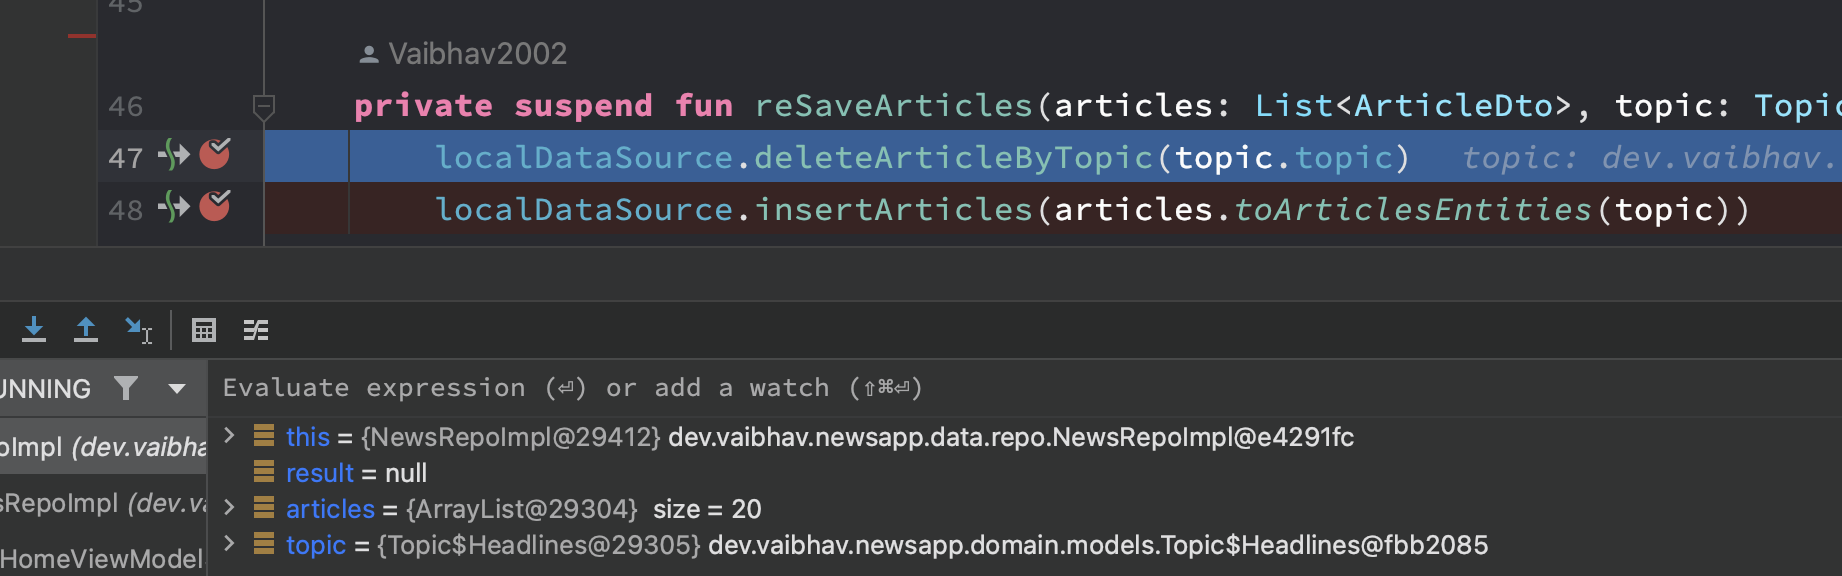
Debugger is very helpful in knowing what data is present, what decisions are being made and knowing how the execution is flowing and finding out the exact line which has the bug.
Layout Inspector
What is it?
The Layout Inspector is a powerful tool in Android Studio that allows us to inspect and debug the user interface of our Android apps. It provides a visual representation of the layout hierarchy of our app's UI, allowing us to see how different UI elements are arranged. With the Layout Inspector, we can easily identify and resolve issues related to UI design, such as layout problems, rendering issues, and performance issues. This tool is essential for those who want to create high-quality apps that perform well on a variety of devices. In this way, the Layout Inspector is a great tool to create apps that are both visually appealing and performant.
How to use it?
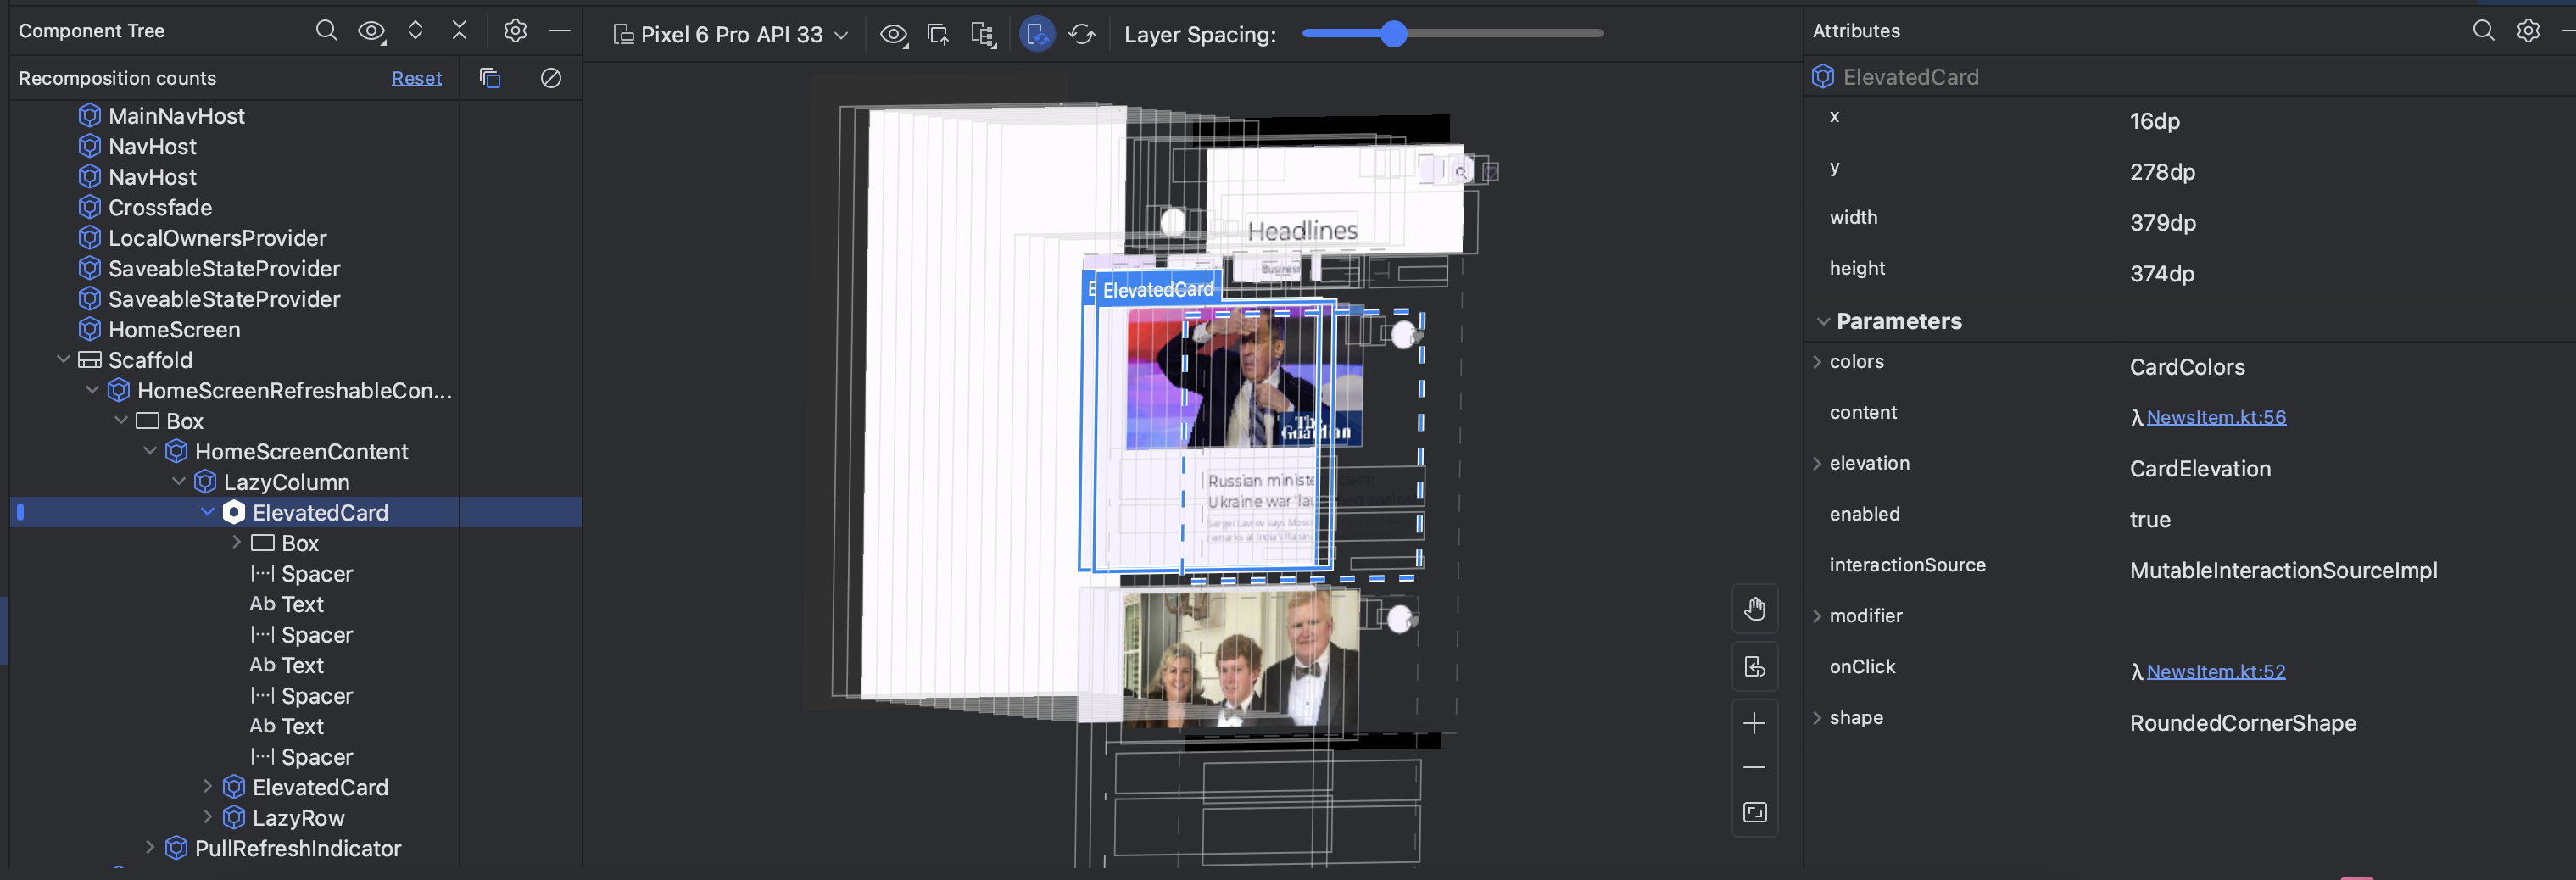
Layout Inspector can be found by pressing the Layout Inspector tab at the bottom of Android Studio. First of all, we need to run our app and navigate to the screen whose layout we want to inspect. Then after opening Layout Inspector, we can see such a window.
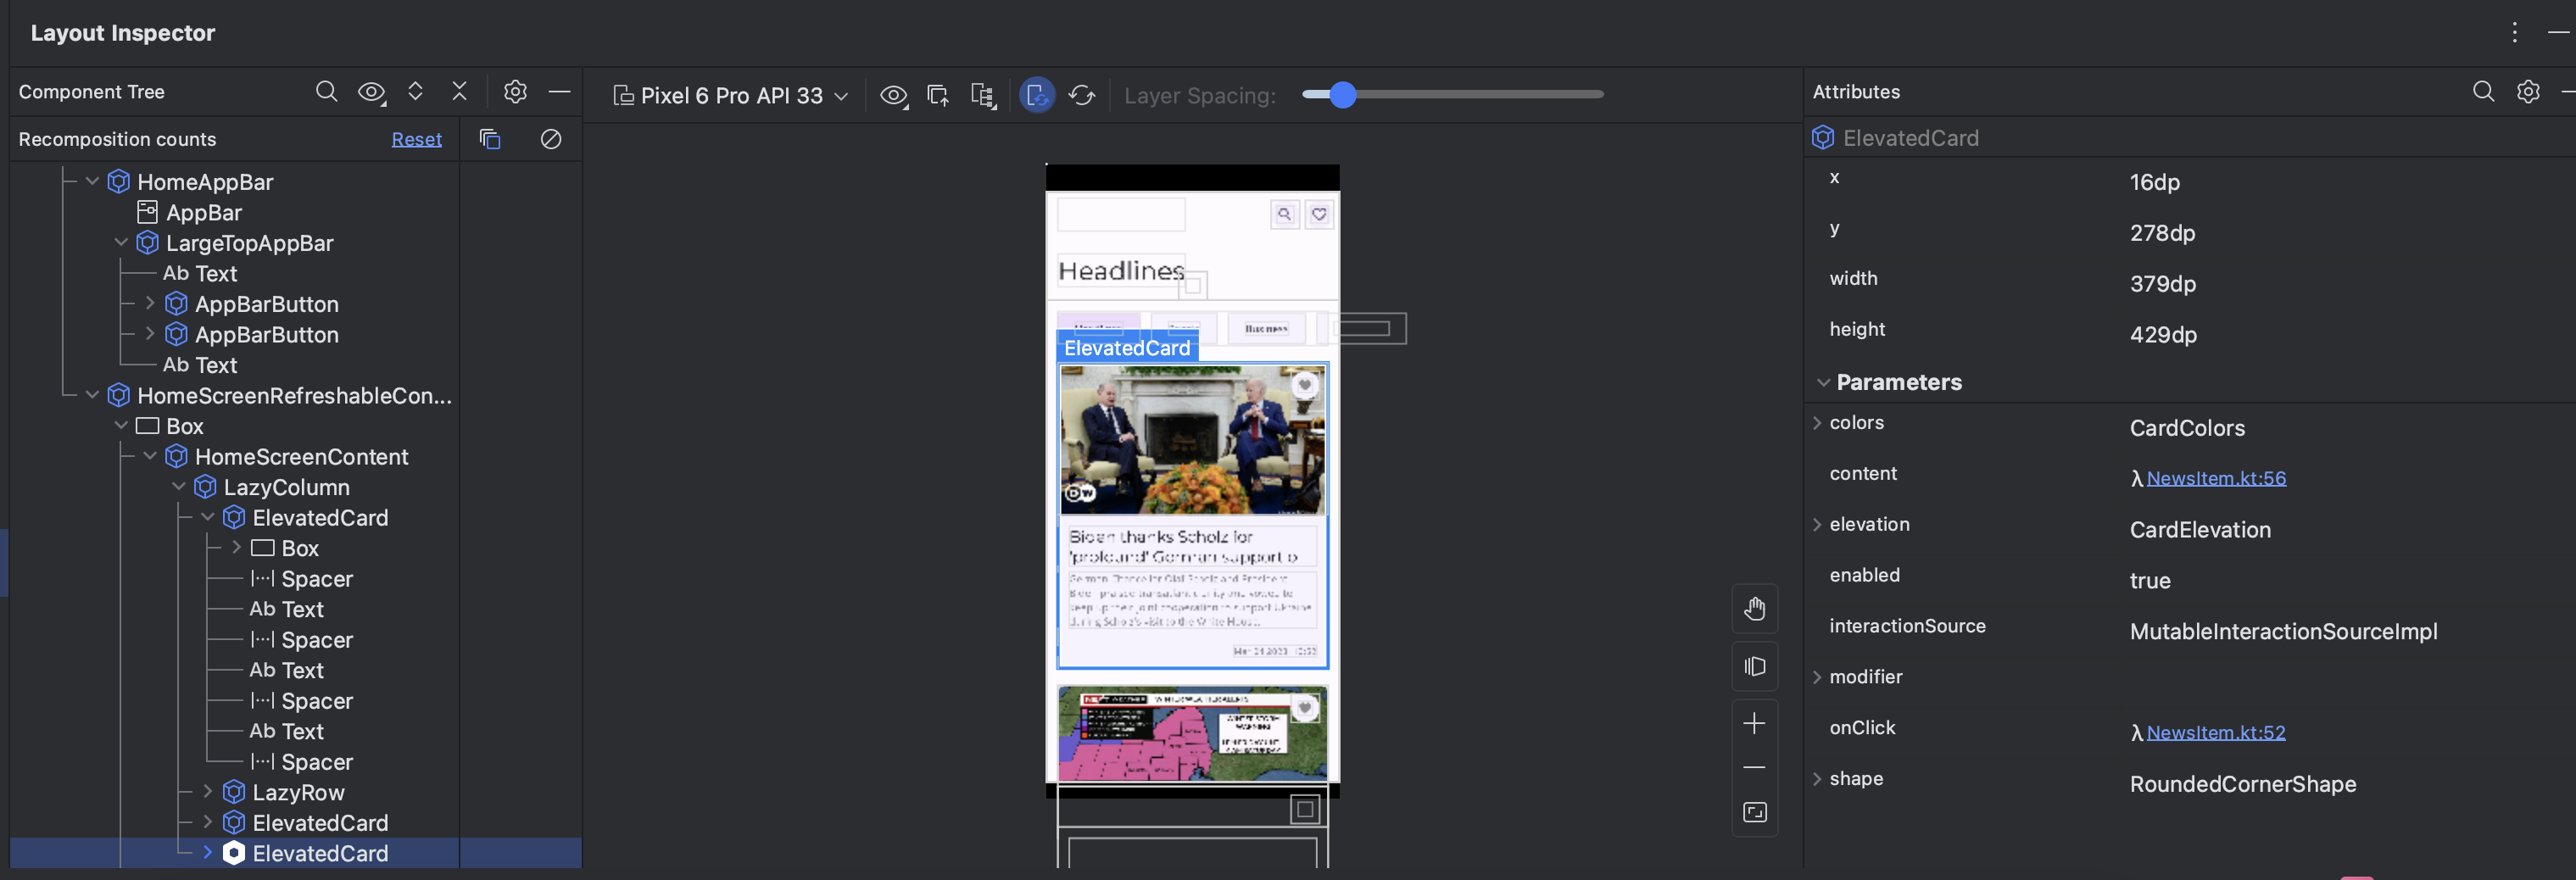
The Layout Inspector window has 3 panels, from left to right.
Component Tree: The component Tree is the View Hierarchy of our layout. It shows the hierarchy of our composables in this case, as it's a Jetpack Compose app otherwise it would show us all the Views in XML-based apps.
Layout: It shows us our layout design and how it is structured, this is real-time, so if we navigate or perform some action, this screen will be updated on its own. This helps us a lot in understanding our view bounds, margins, positioning and other layout factors.
Attributes: It shows us the attributes of the view or composable selected. This helps us to find if in case any of the attributes we applied to the view/composable is actually applied in the view/composable or not. In the case of attributes changing dynamically based on some decision-making or user interactions, Layout Inspector comes in very handy.
Seeing our layout in a flat view might not be very helpful at times when we want to know about the Z-axis or see the elevation of views/composable but we don't need to worry about it as Layout Inspector has a solution for this too. Here comes the 3D view in Layout Inspector. It looks beautiful and we can even rotate the layout and see it from all angles.
Layout Validator
What is it?
As mobile app developers, we want our apps to look good on all types of screens, be it a phone, a tablet or a foldable, so we have to test it on all devices but keeping all types of devices is not possible for everyone and making multiple emulators chokes our Storage and RAM. Here comes Layout Validator to the scene. Layout Validator lets us see our design on all kinds of screens in Android Studio itself without running any emulator. We can just select the devices we want and see how the design looks in each of them.
How to use it?
Firstly we need to open the XML, then press on the Layout Validator tab on the right side and such a window will open.
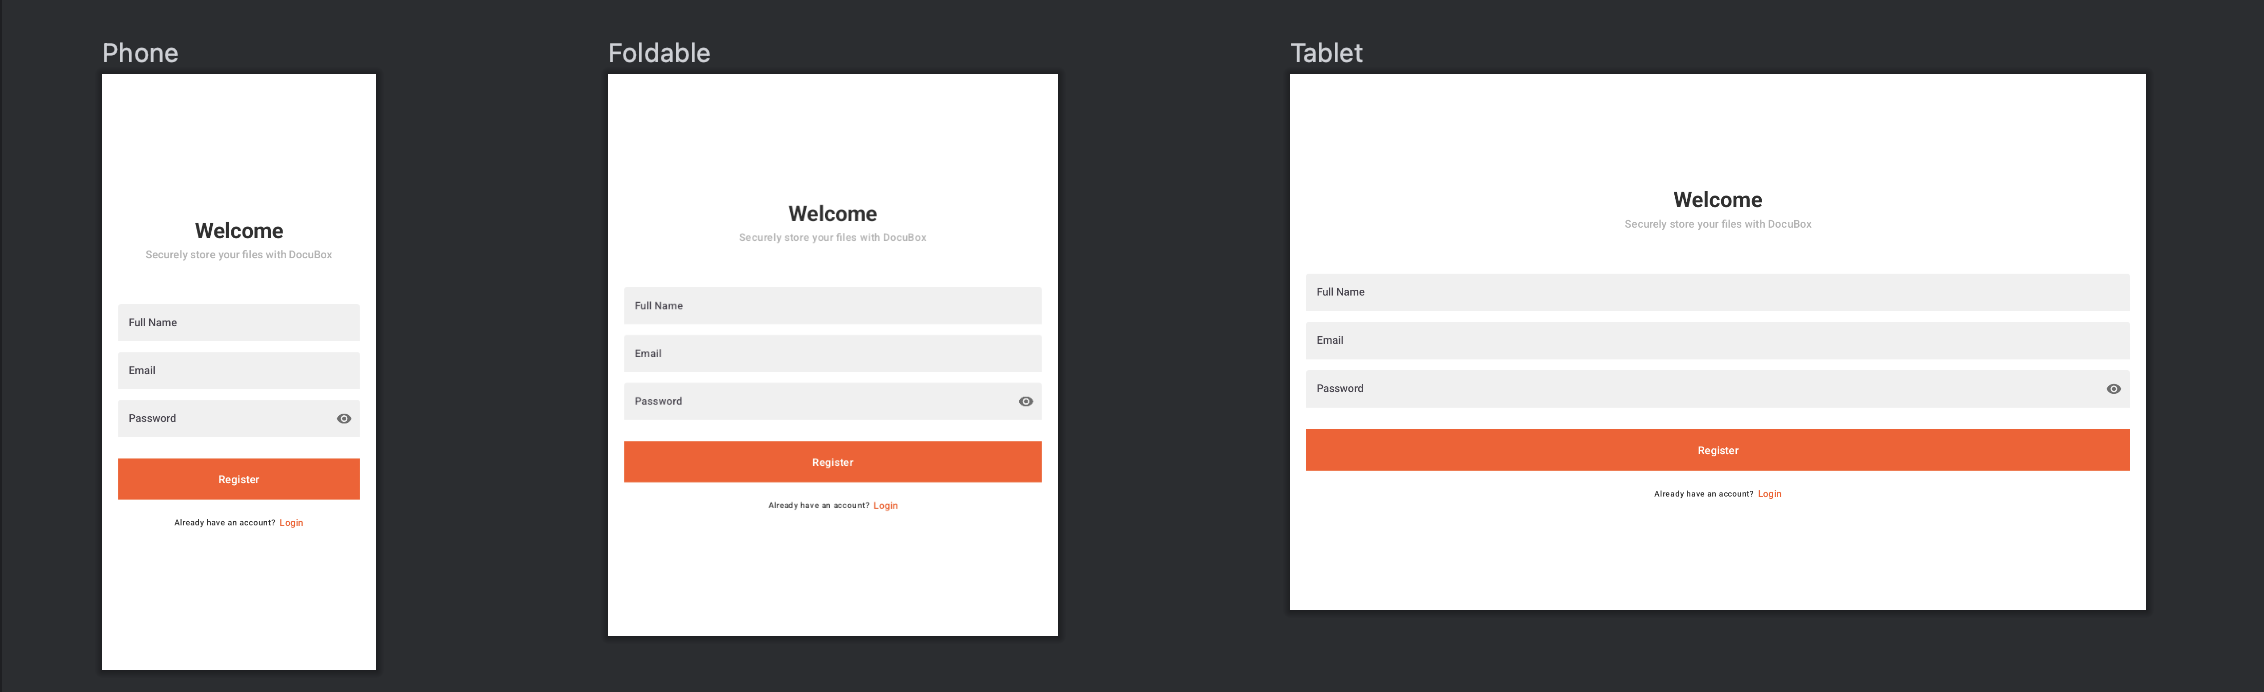
Here, we can see how our created design will look in different screen sizes, here it shows a phone, foldable and tablet. We can even create a different set of devices to view our design in, like all Pixel devices or a given set of phones.
This helps us solve a lot of UI layout-related bugs, like the screen looking odd or views overlapping in small screen sizes and hence we can fix them on the go and avoid getting Bug Reports stating the UI looks super weird in some different phone and us telling our manager
"It works on my machine"
Profiler
What is it?
Profiler is a crucial tool for all Android Developers, it lets us optimize the performance of our apps by allowing us to monitor and identify issues in CPU usage, memory allocation, energy consumption and network connectivity. By using Profiler we get to know what is causing issues a.k.a. bugs and why it is there at all. Hence we can then work on it and optimize our app to provide to most fluent and smooth User Experience.
Using Profiler we can do 3 types of profiling, and they are:
CPU Profiling - It allows us to measure the time taken by our app on each method and even code lines, a longer CPU time means the app will skip frames, cause lags, jitters and janks and these can lead to really bad UX and should be fixed in priority.
Memory Profiling - It helps us to analyze the amount of memory our app is using, and memory leaks which can lead to potential crashes. Memory usage should always be optimized as no one likes an app to eat up all their RAM.
Energy Profiling - It helps us to analyze the power consumption of our app, It gives us detailed information on which part of the app is using too much battery. This comes in very handy when developing games, so we can optimize them.
How to use it effectively?
To use it, firstly we need to connect a device or an emulator and run our app. Then click on the Profiler tab at the bottom then we can see a similar window.
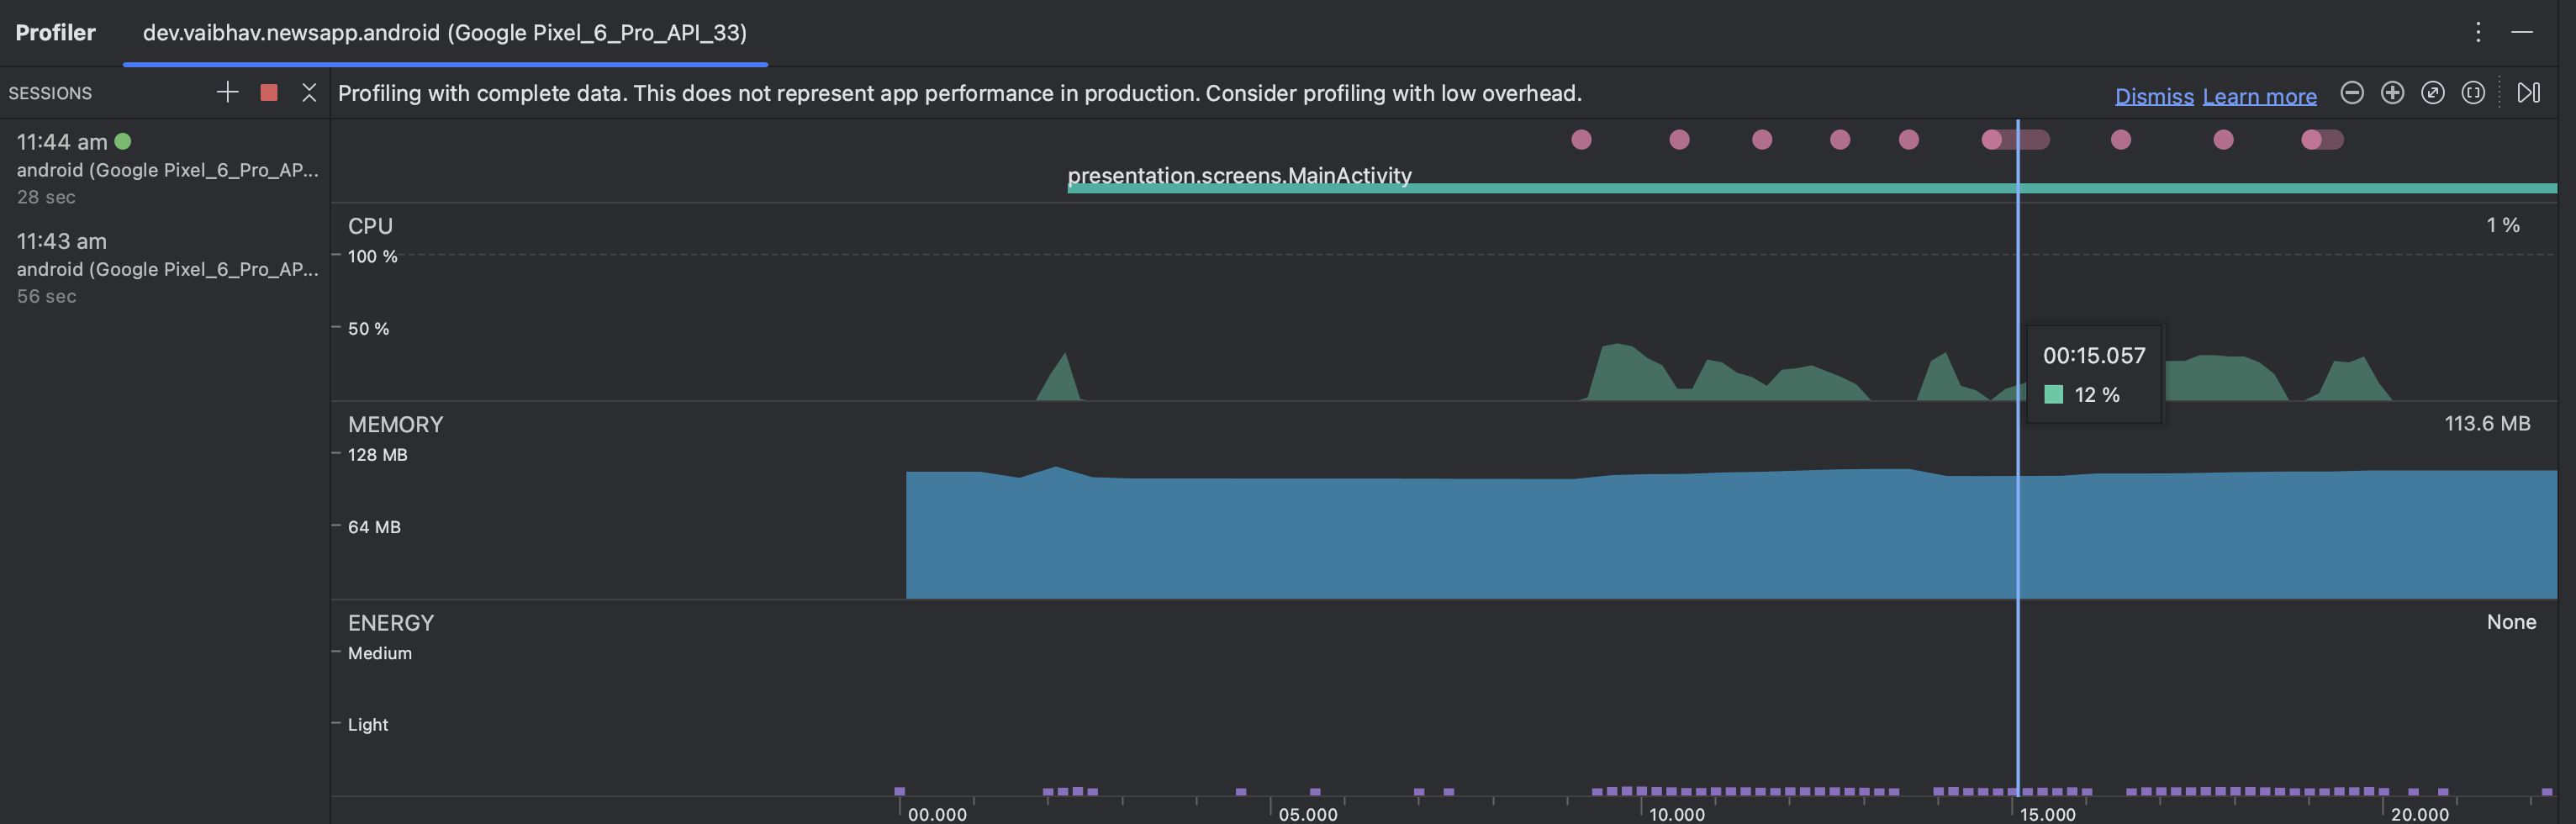
Here we can see the CPU usage, Memory Usage and Energy consumption of our app, the pink dots on top shows user interactions. We can click on any of them to open a detailed view of it and can record it.
In this blog, I will only show you about CPU Profiling and will be releasing a complete detailed blog on Profiling soon 😉. So follow me up, so you don't miss my upcoming Android Profiler blog.
When we click on the CPU Profiler graph we can see a detailed view of it, with options to record different types of tracing.

Here we can see the CPU Activity of our app, even the activity of each thread. We can record CPU usage to track down bugs and inefficiencies in our app, it shows us a detailed view of the CPU activity of our app. There are mainly 4 types of Recording options.
Callback Sample - It records a sample of the CPU utilization at regular intervals, mainly when invoking callbacks. It helps us to know the performance of the app's callback methods and find bottlenecks and inefficiencies.
System Trace - It records all kinds of CPU activities, like thread activity, process activity and system calls. It helps us to identify performance issues with the Android System calls. It provides us with a detailed view of how our app interacts with the Android OS.
Java/Kotlin Method Tracing - It records the time of execution of the Java/Kotlin code of our app. It shows us how much time a Java/Kotlin method takes and how frequently a Java/Kotlin method is executed. It helps us optimize the code we write to work faster.
Java/Kotlin Method Sample (Legacy) - This is the old legacy version of the Callback Sample and is now deprecated.
The System Trace recording looks like this
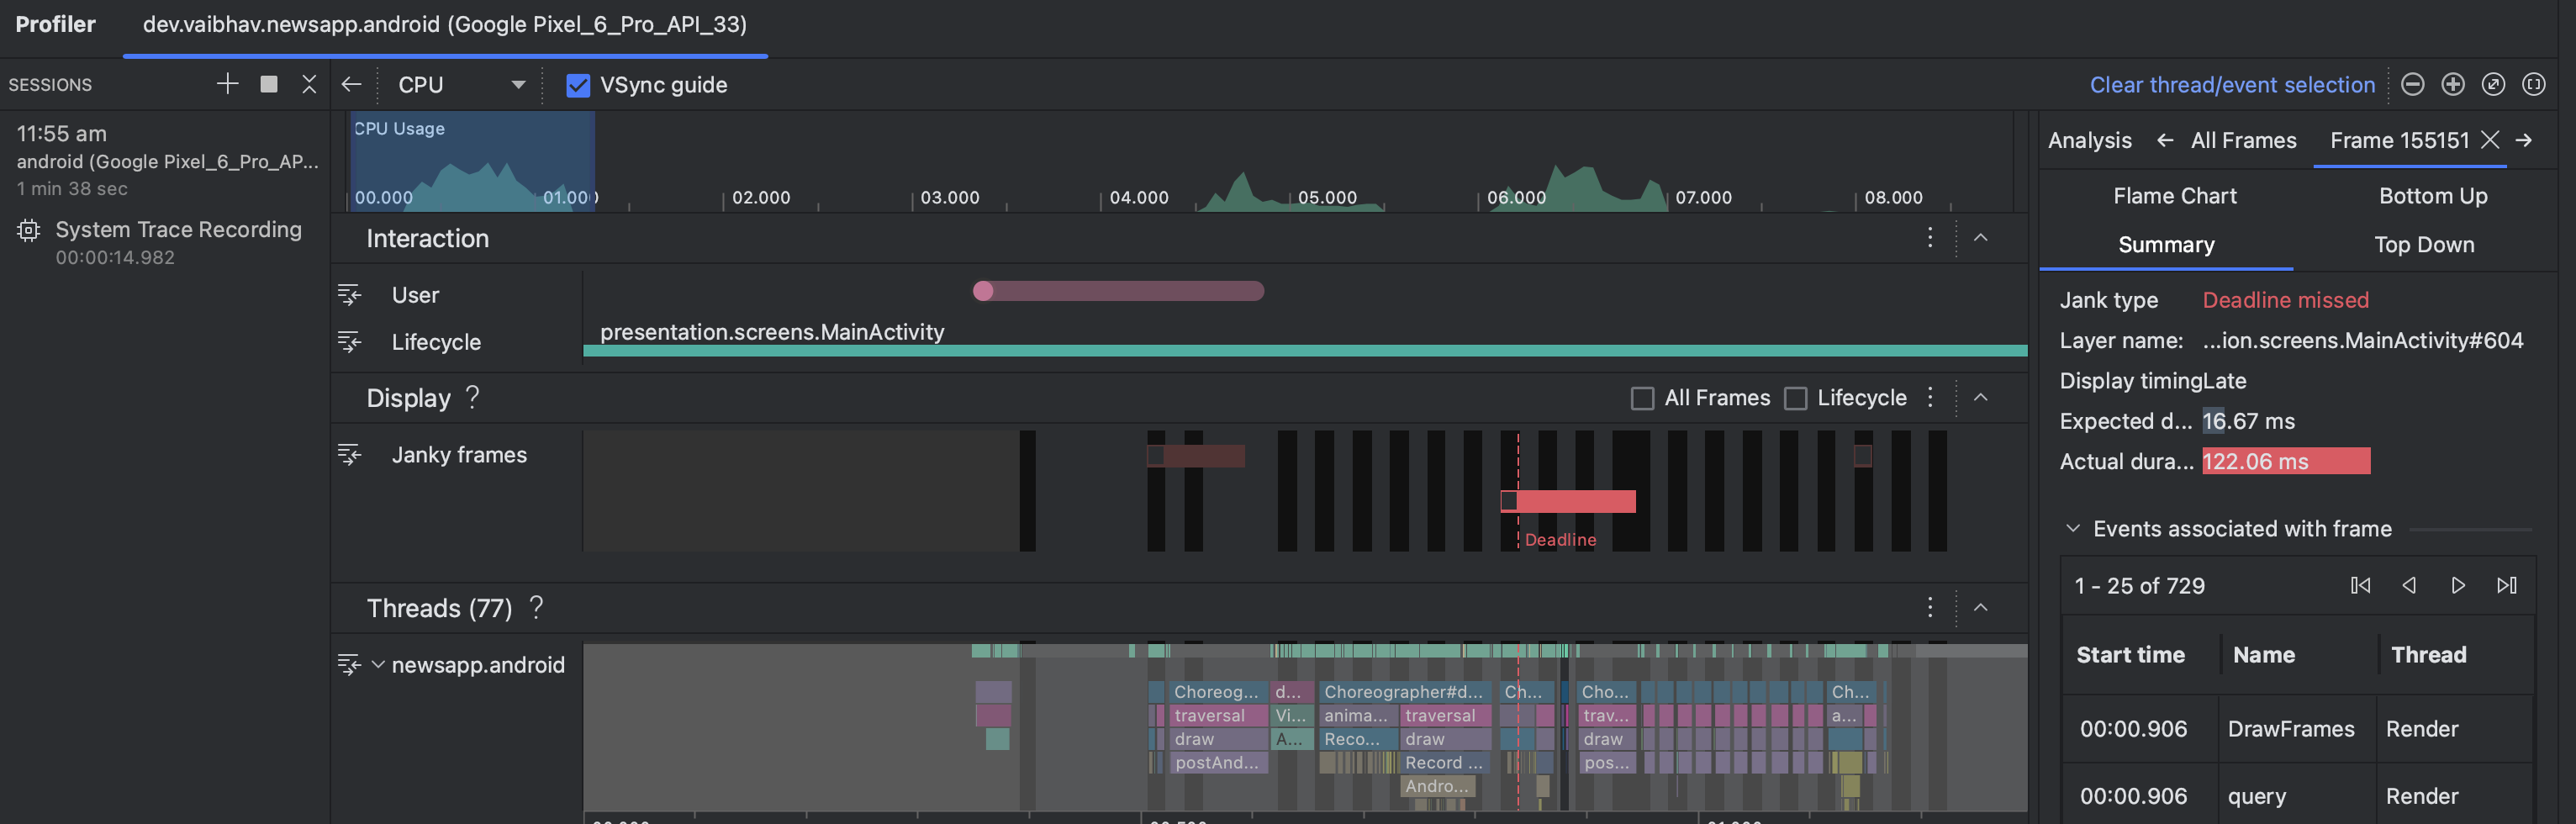
Here the red bars indicate the Janky Frames. Janky Frames mean the frames which take more time to render than the usual 16ms frame time. This tells us that we need to optimize the task which is taking this long to execute, this usually happens if we do some heavy operation on the system's Main Thread.
On the right, we can see the details of the Janky frame by pressing it.
Will explain more about this, and how to find the reason and optimize our code to remove such janks frames in my upcoming blog.
So that is all for this blog, will be back with more content 😉
So what did we learn from this blog?
So we learnt about the Debugging tools provided to us by Android Studio. These tools include the debugger, logcat, profiler, network inspector and more. By using these tools we can find bugs and performance issues in our app and fix them to provide our users with the best experience (so they don't uninstall our app 🙃).
Debugging is a challenging task, frustrating too at some times, but if we use the correct tools and in the correct way, it can be very easy and fun. Android Studio provides us with such great tools and we should make learning them a priority as it will help us a lot in the longer run.
So rather than just staring at our code trying to debug, let's start using these and make our work easy, and give some rest to our eyes after staring at the screen for soo long.
Resources 📚
To learn more about these debugging tools, you can visit Android Docs.
The images used in Database Inspector are taken from the Android Docs.
All the other images are taken from my app NewsGo. You can go through NewsGo to learn more about optimization and best practices to avoid bugs.
Vote Of Thanks 🤗
Thanks a lot, Hashnode for organizing such Writeathons, feels great to see bloggers from all around the world contribute some great blogs. It gives us so many learning resources. I hope this article helps all Android Developers, even developers of all other domains learn about the Debugging features of Android Studio to help us develop Android Apps with ease.

